Release Notes - 29th of May 2026
Reports
We've refreshed your Reports display to make report data easier to read, track, and work with across all applications.
- Enhanced Display
All reports across Application > Reports have been updated with an enhanced display, giving teams a cleaner, more readable view of their data.
The refreshed layout improves how report rows, columns, and key metrics are presented; making it easier to scan, compare, and act on information without changing how reports work. The same functionalities are retained for:
- Export = download any report to Excel
- Save = save favourite report configurations for quick access
- Columns = choose which columns to show or hide
- Filters = all existing filter and sort options remain unchanged
Costing Application Reports > Overview 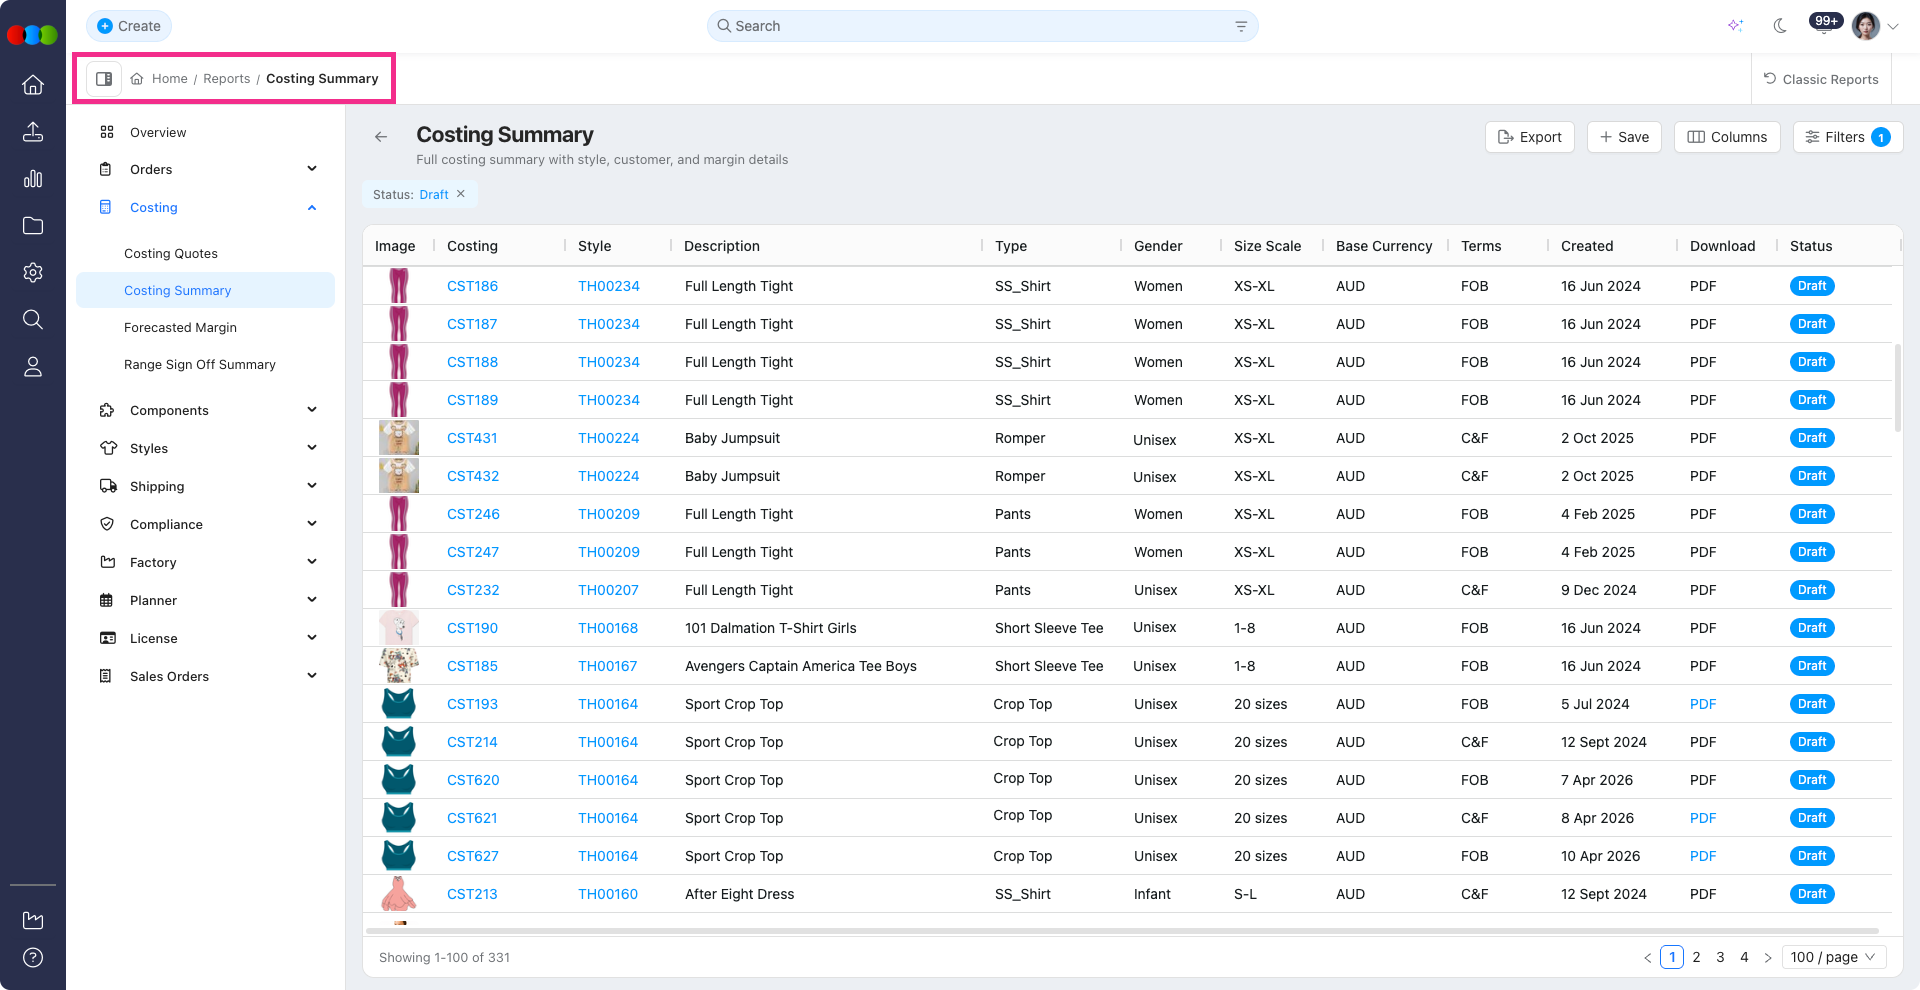
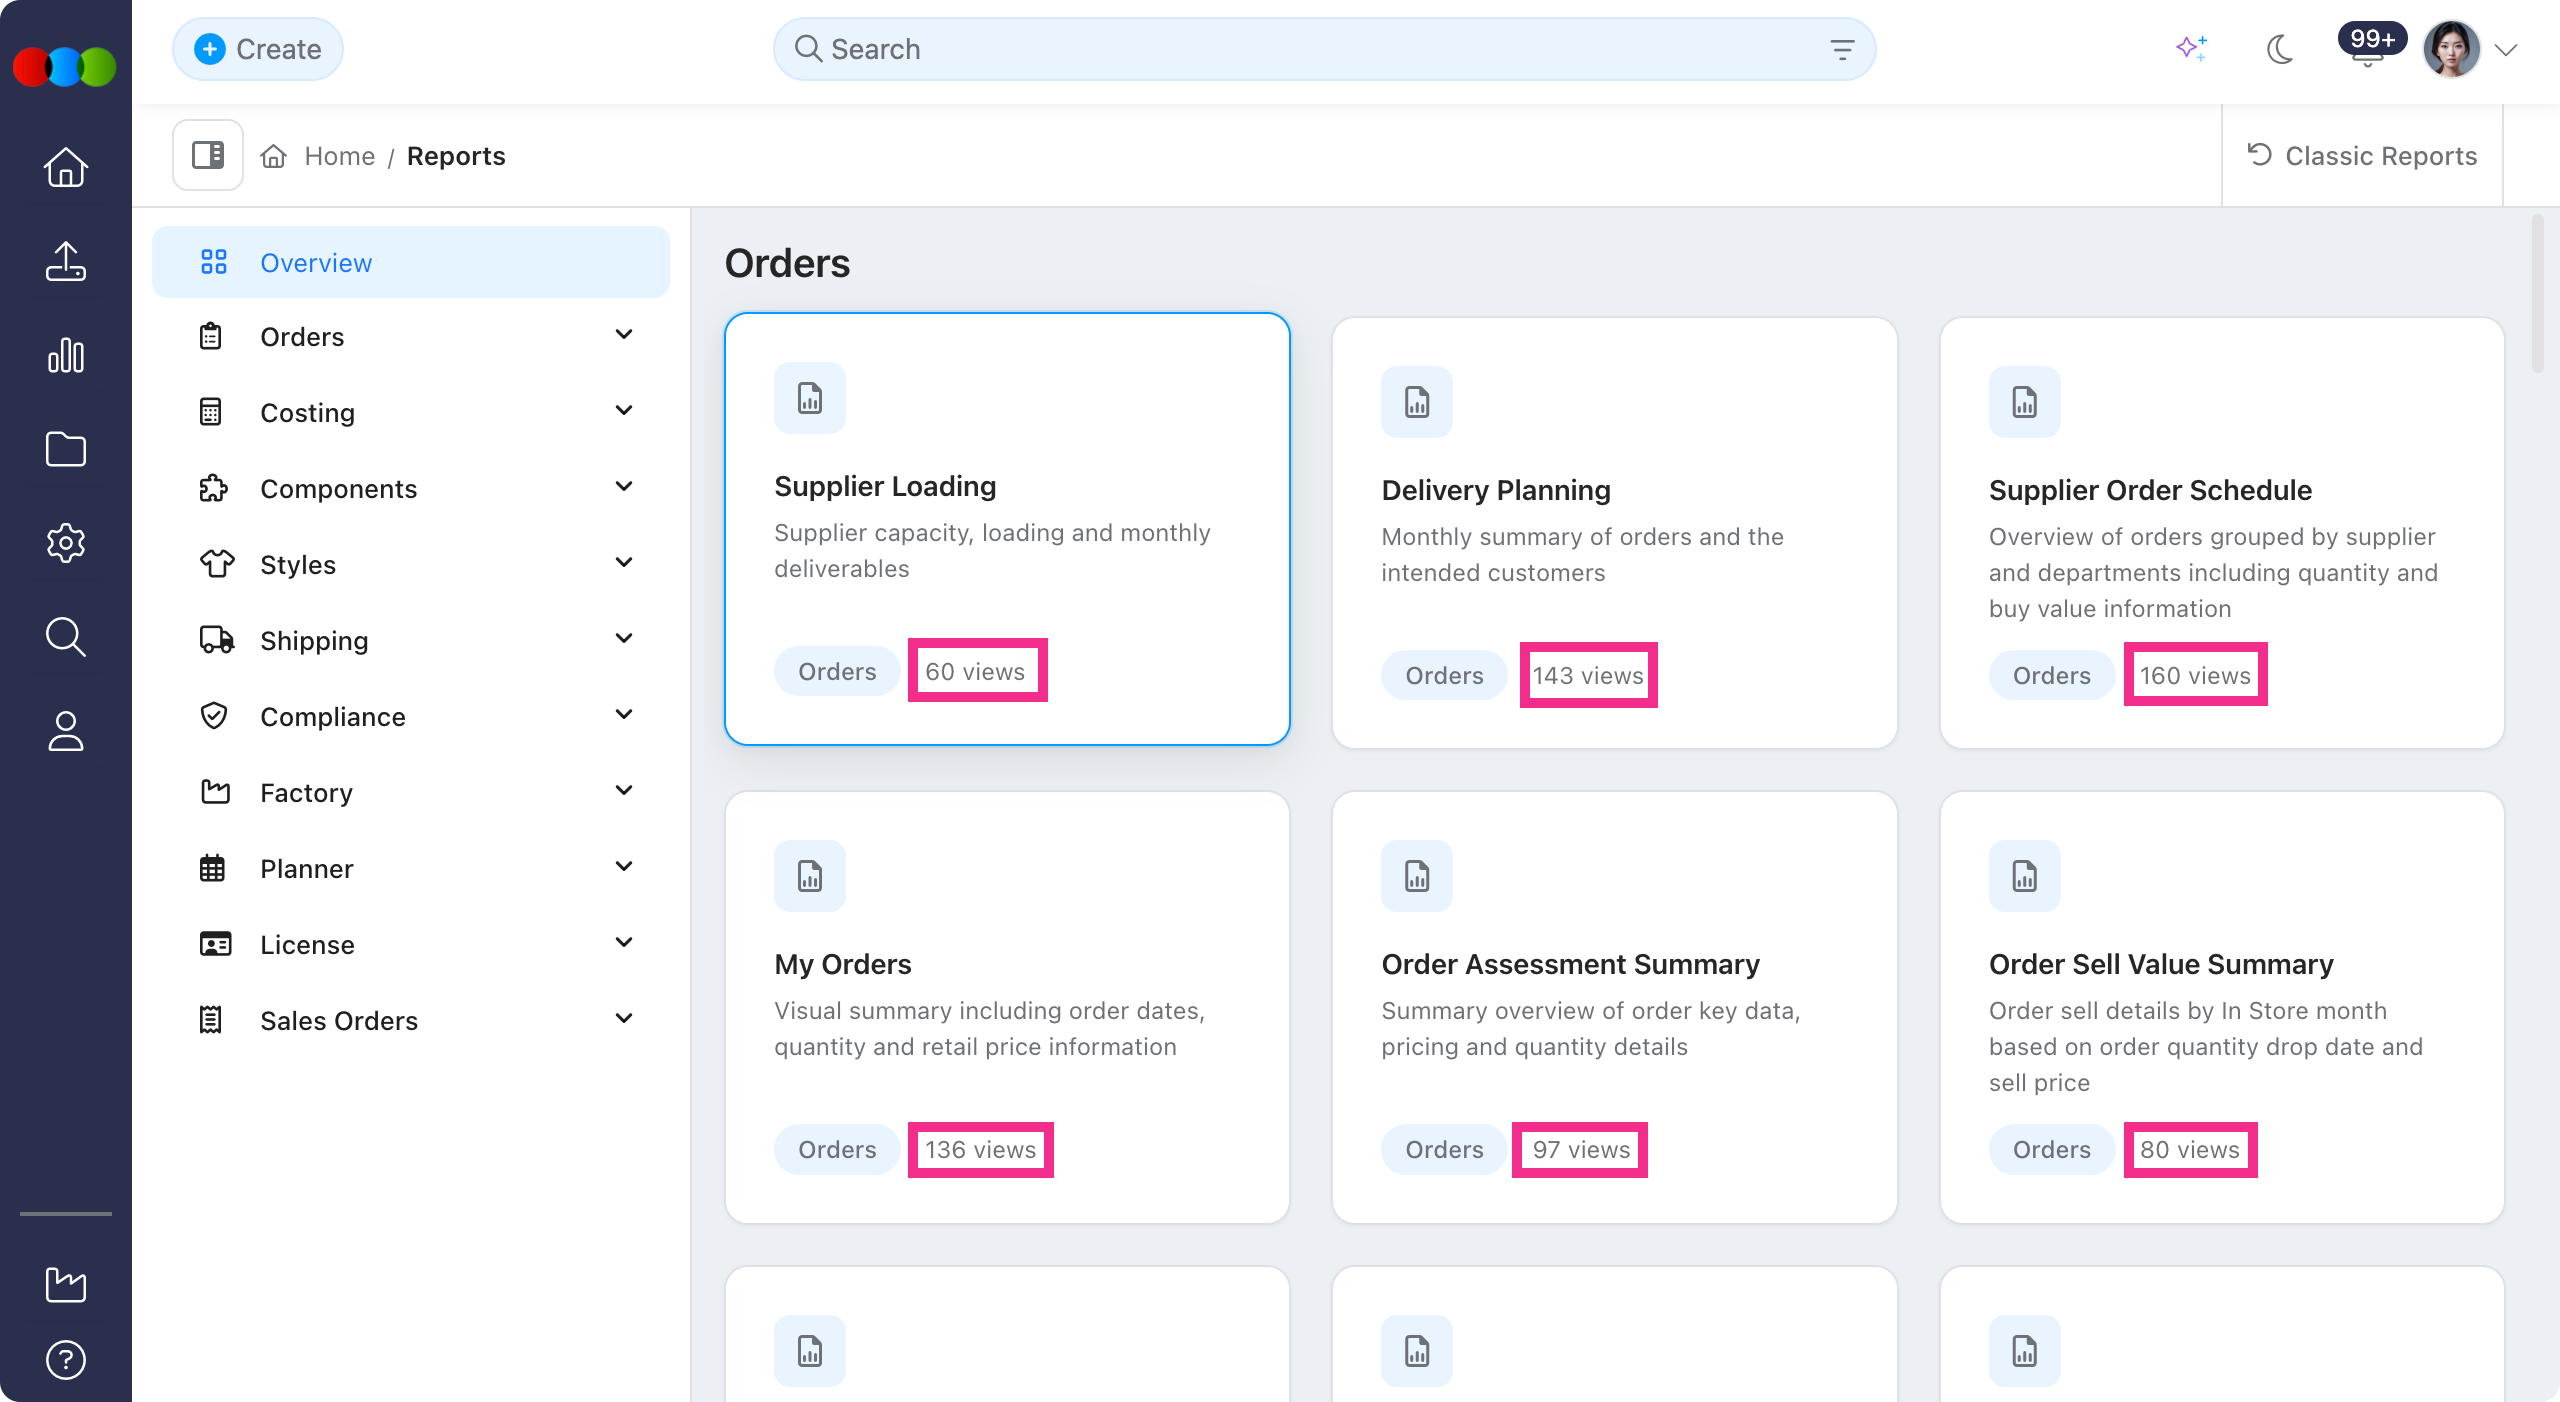
- Views
Reports now display a Views count, showing the total number of times a report has been opened. This gives teams visibility into which reports are most actively used across the business.
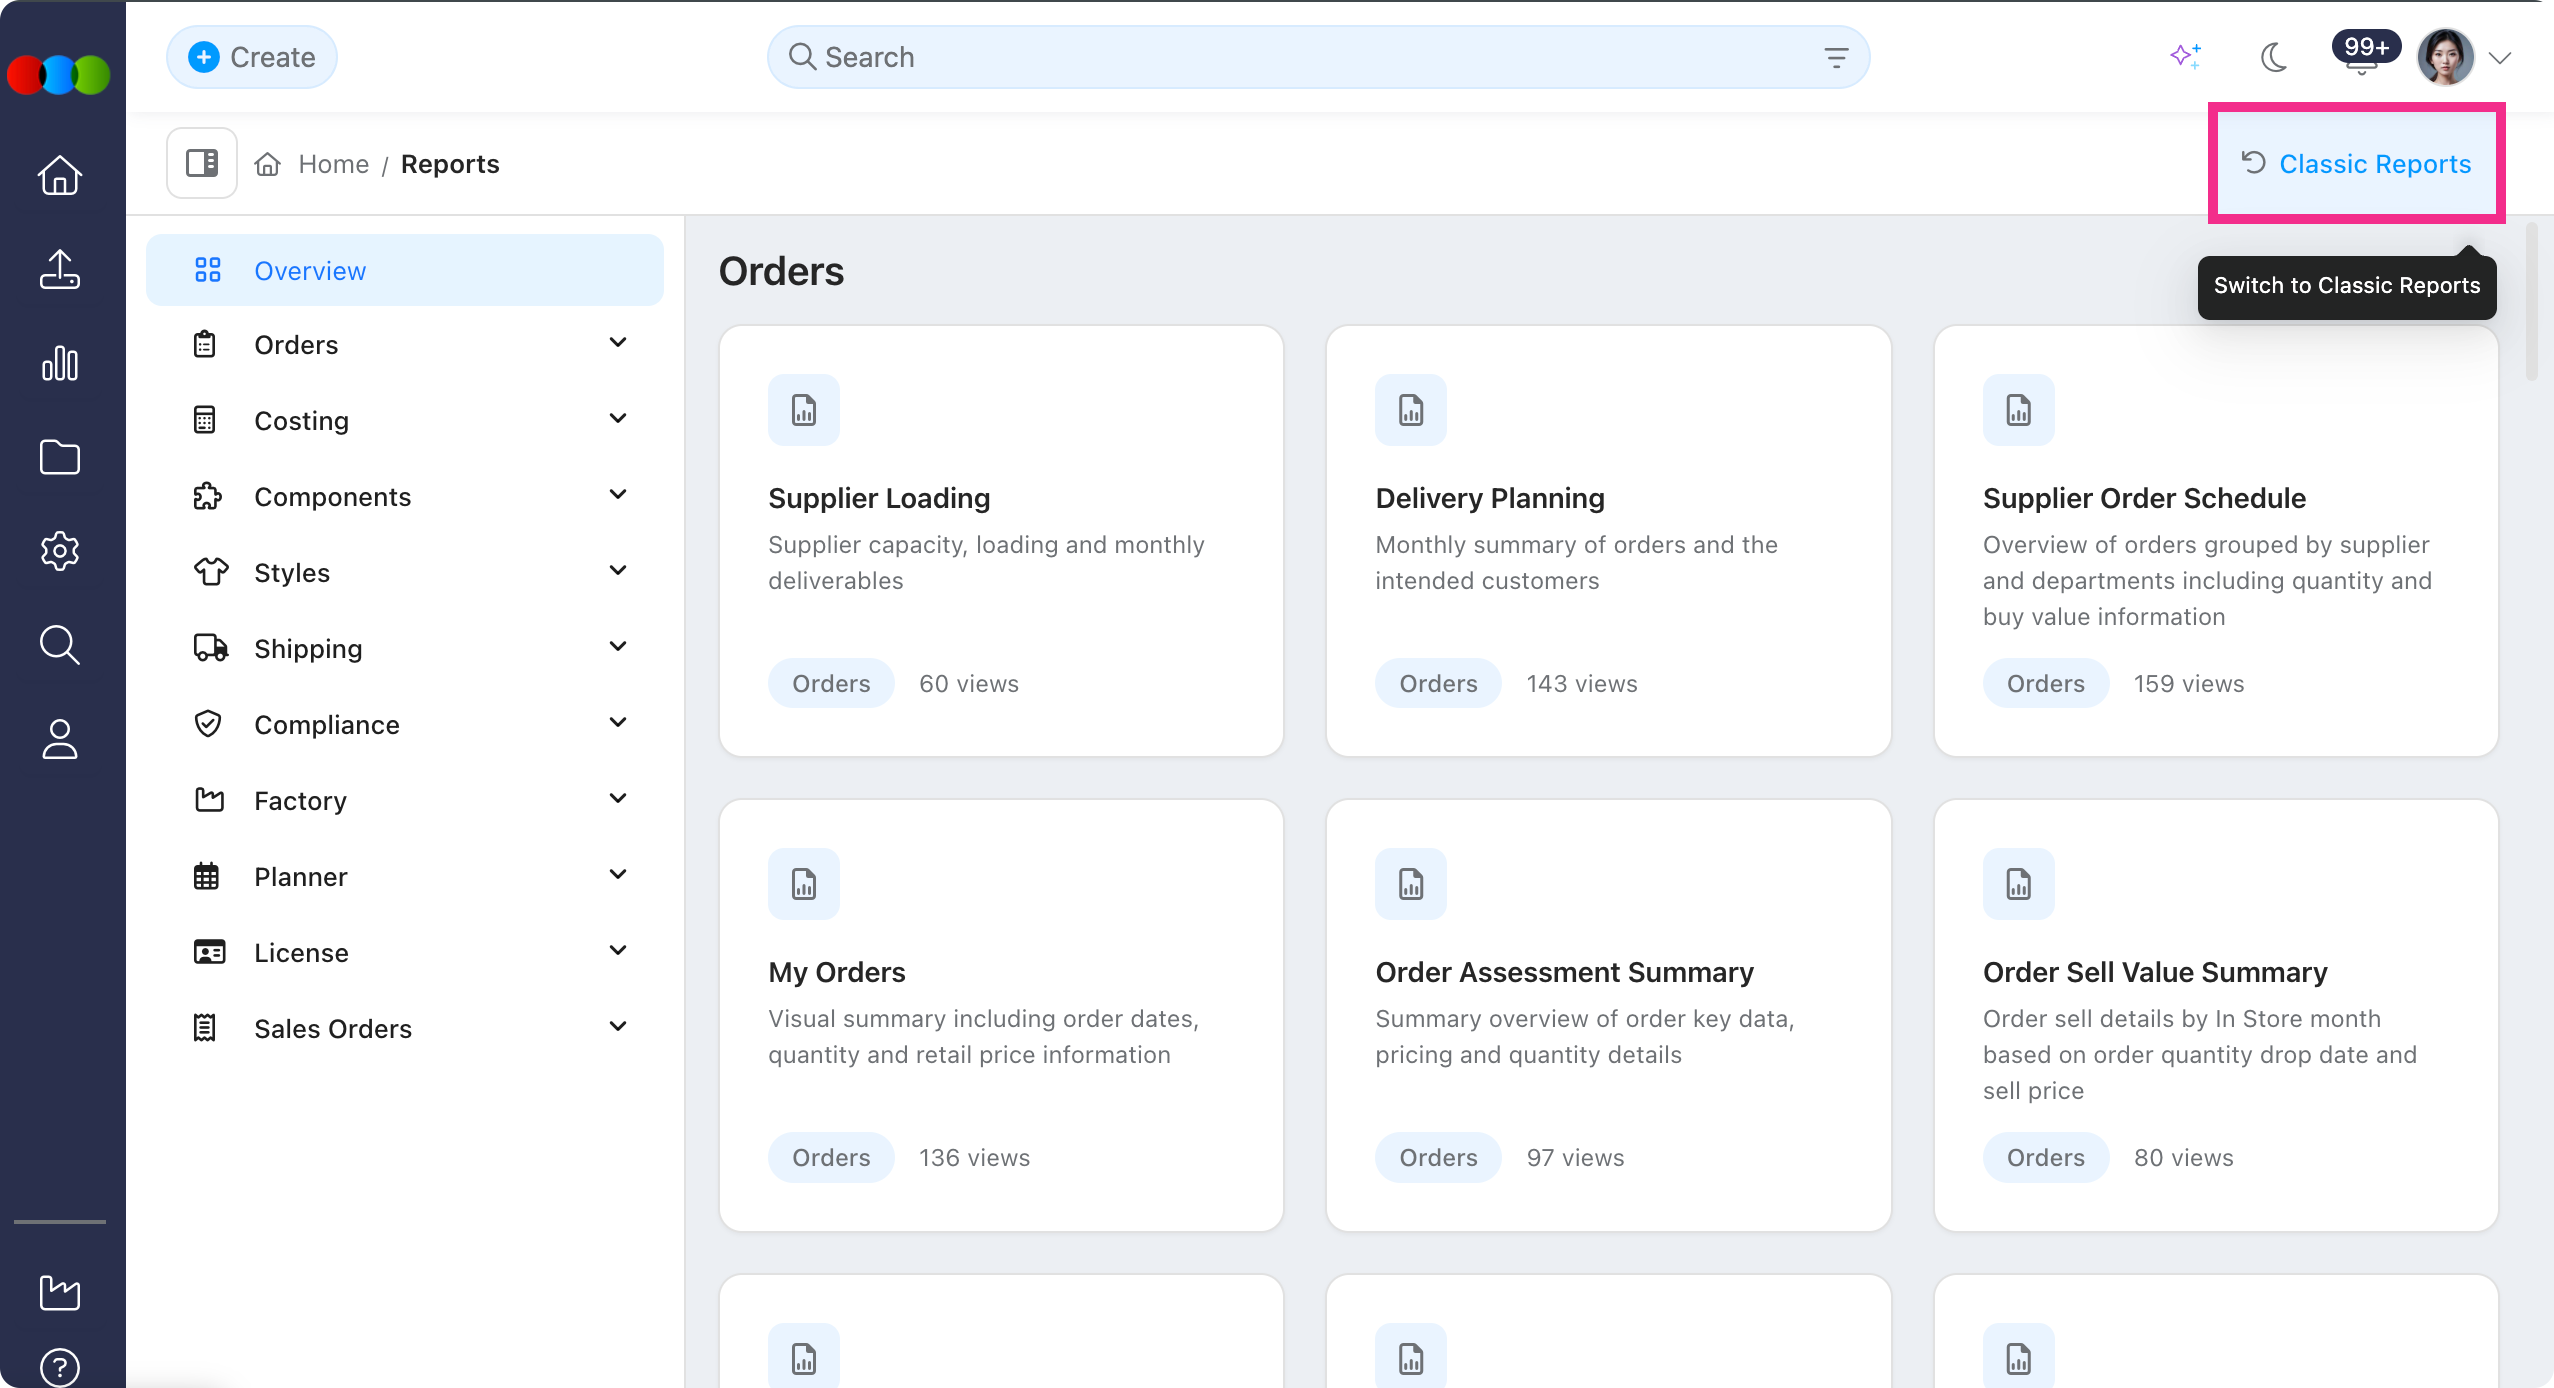
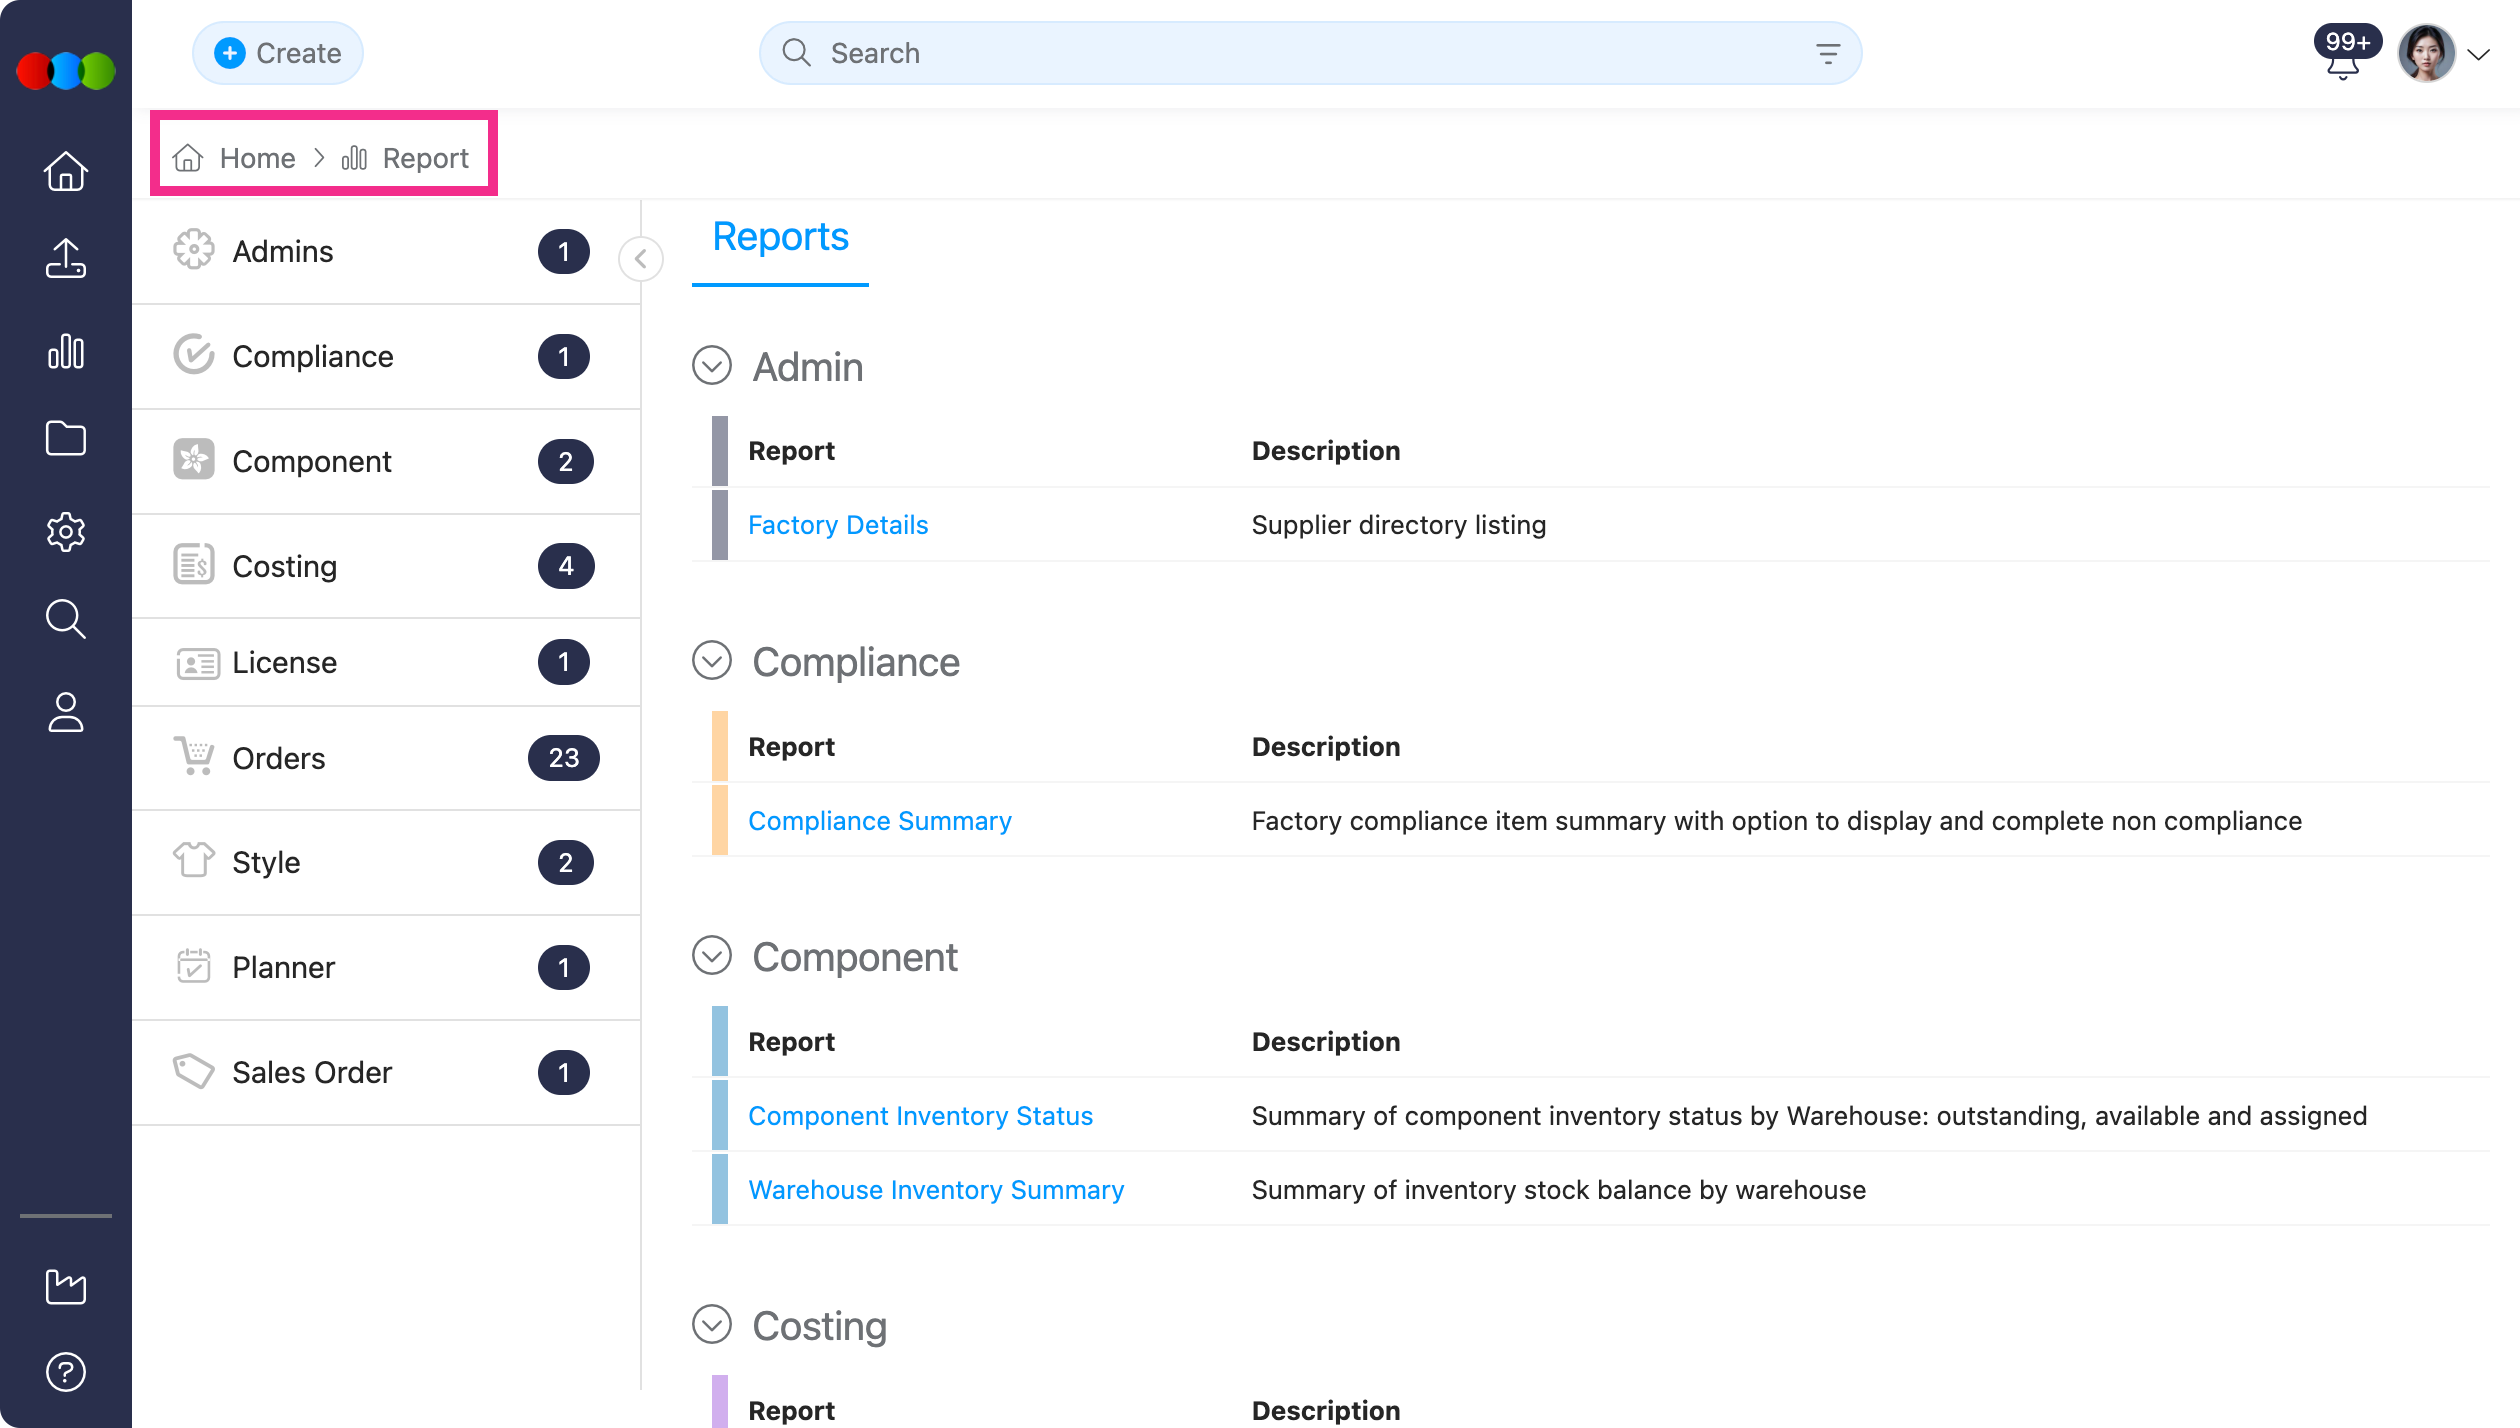
- Classic Reports
Moreover, if you prefer the previous display on how reports are presented, you can revert any time by clicking the Classic Reports.
Dig deeper on Reports
Head to Reports > Overview for report configuration options including filters, columns, and export.
Site Settings > Style > General Settings > Mandatory Fields
Tariff can now be selected as a mandatory field in Site Settings > Style > General Settings > Mandatory Fields .
Site Settings > Style > General Settings > Mandatory Fields > Tariff 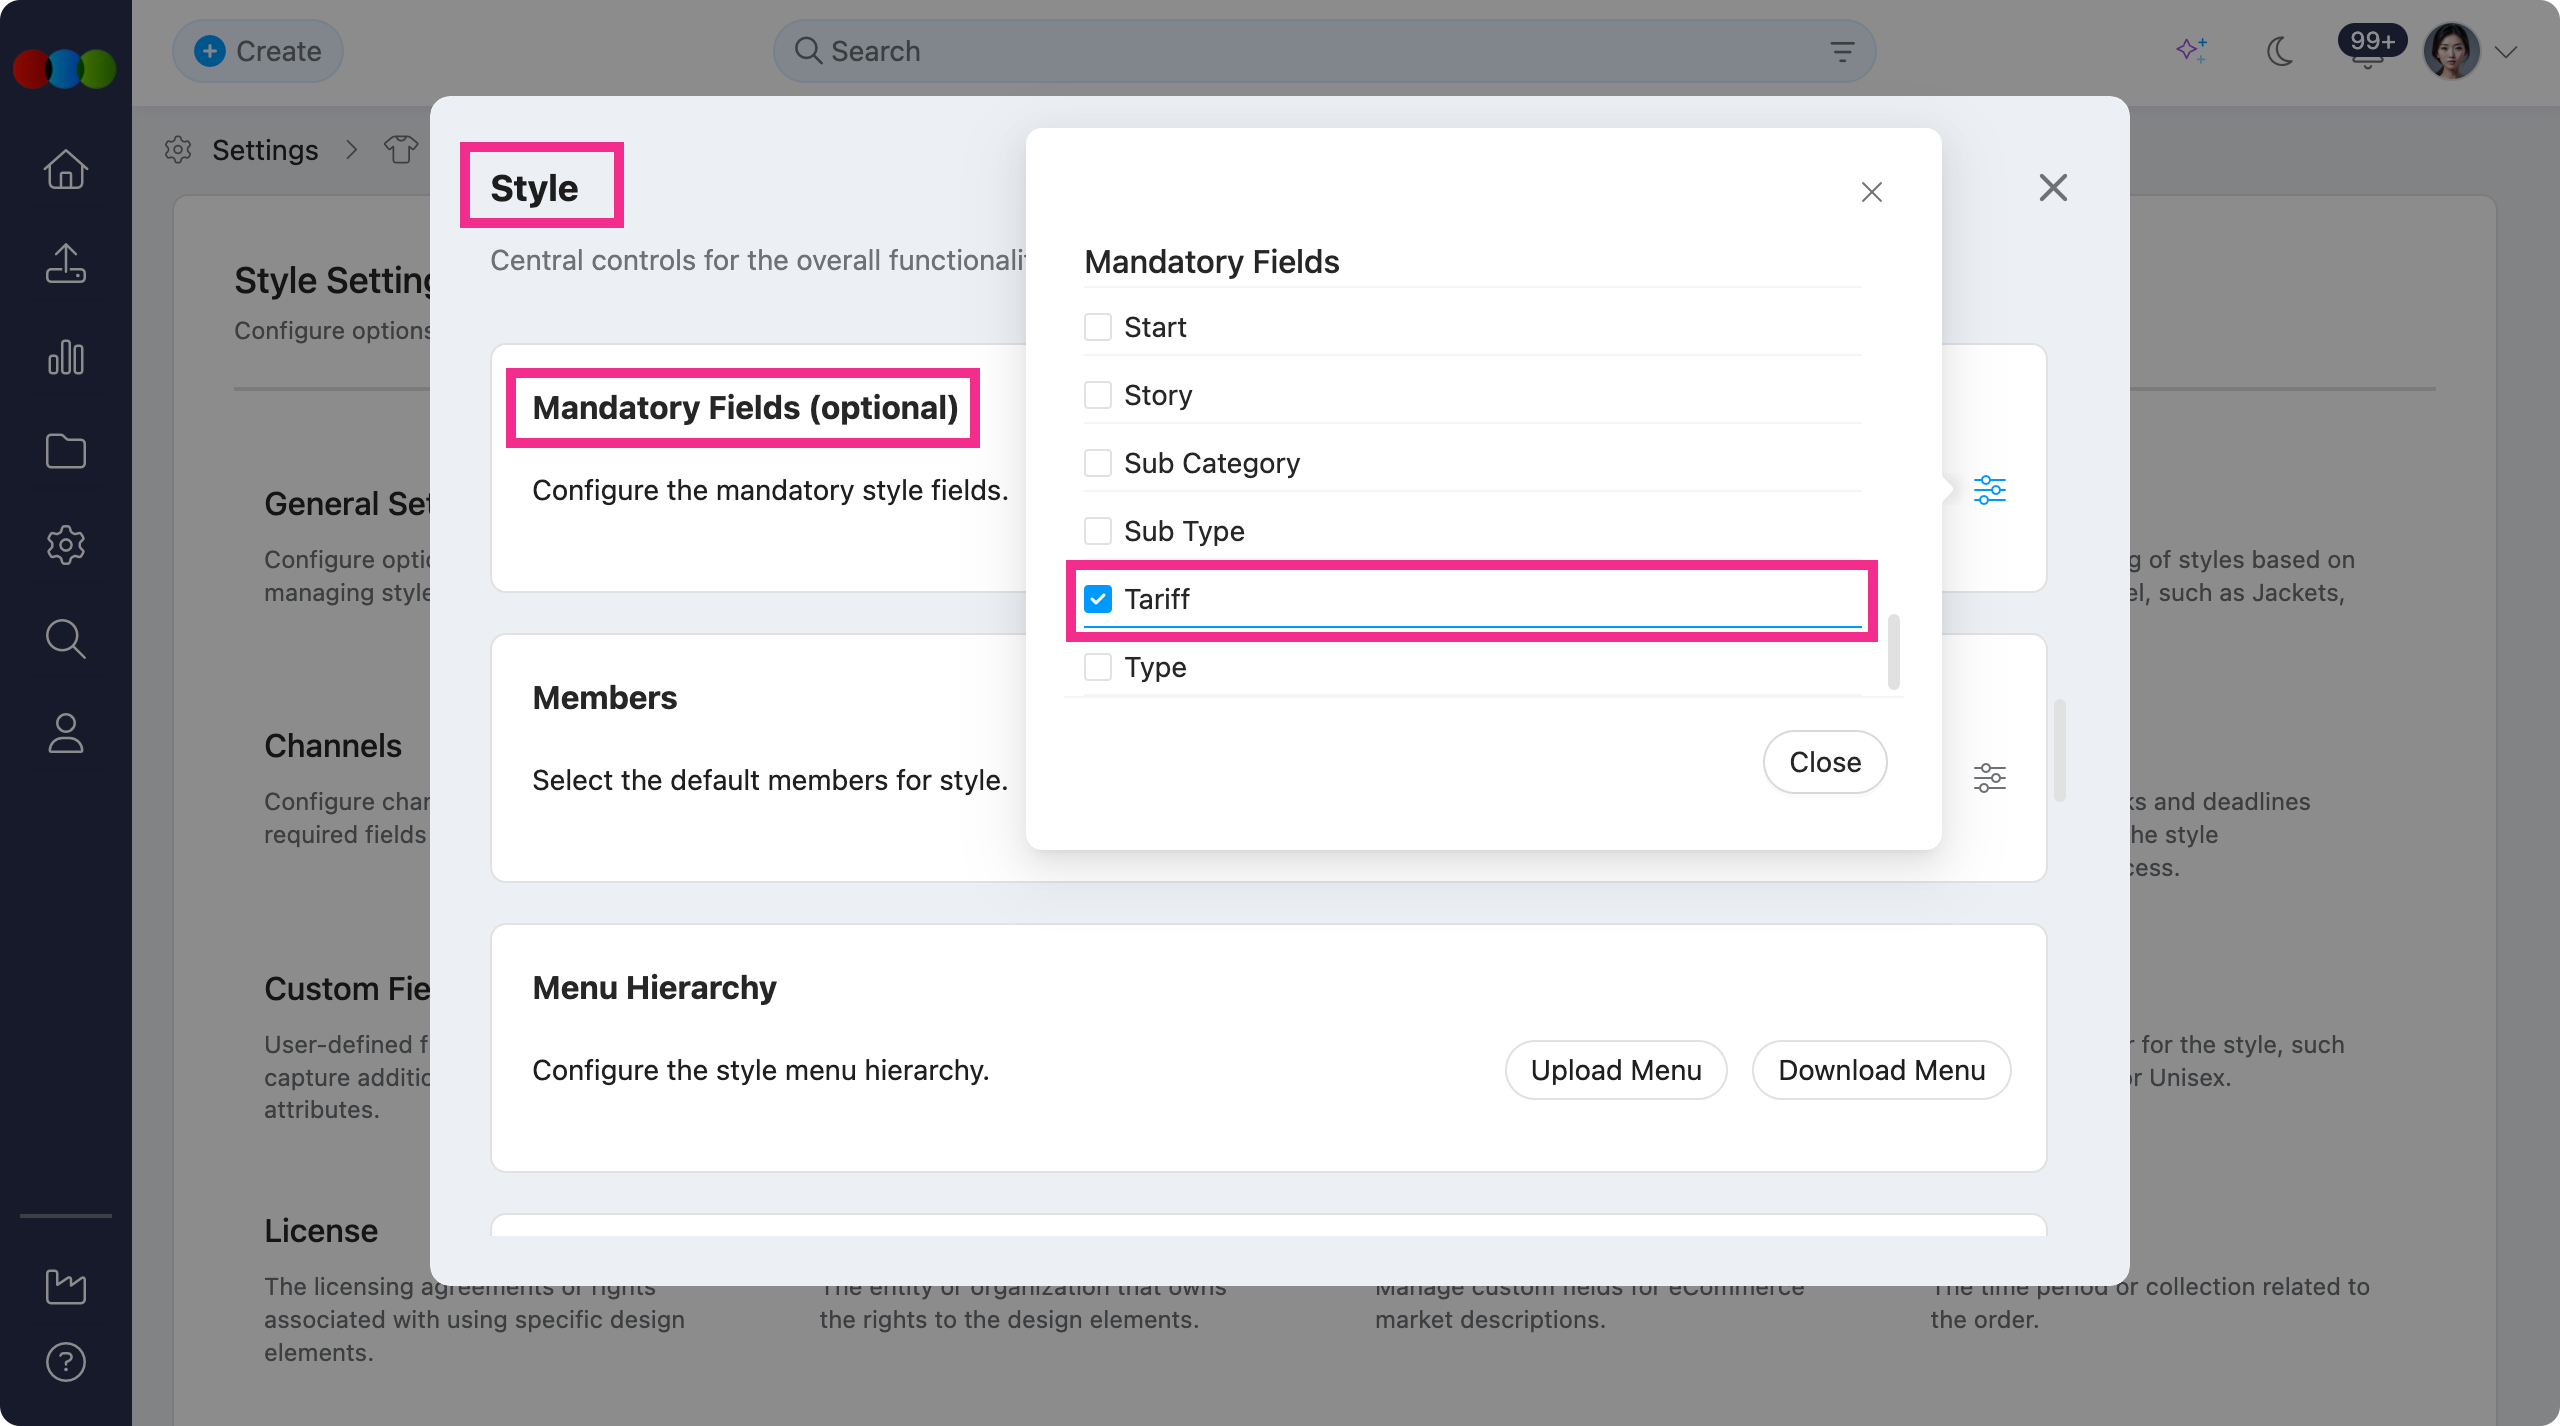
Thank you for helping us make things better! If you spot anything else, let us know — we're always here to help.
Happy clicking!
Previous Release Notes